Segment your audience using a variety of methods


Join 1000+ companies who's reached Around


How does it work?
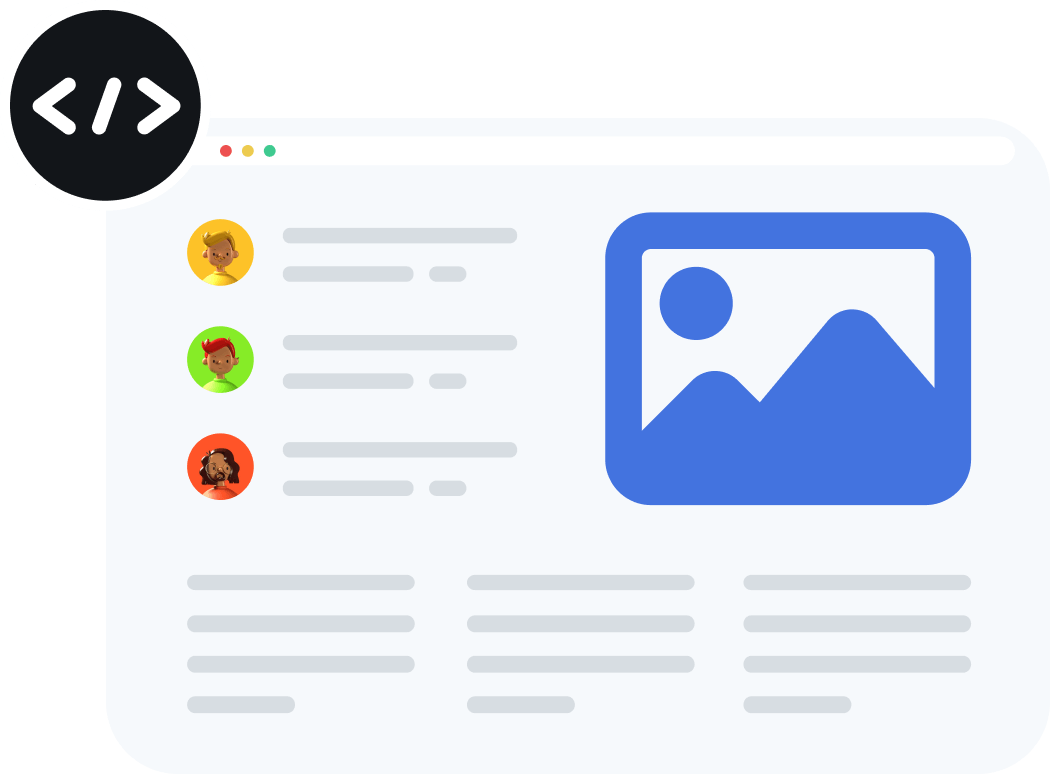
Connect your site to the platform using a code
Nec id eget malesuada urna at sed est adipiscing auctor at massa id duis fames ut condimentum velit est, donec mauris tortor massa et viverra.
Get connected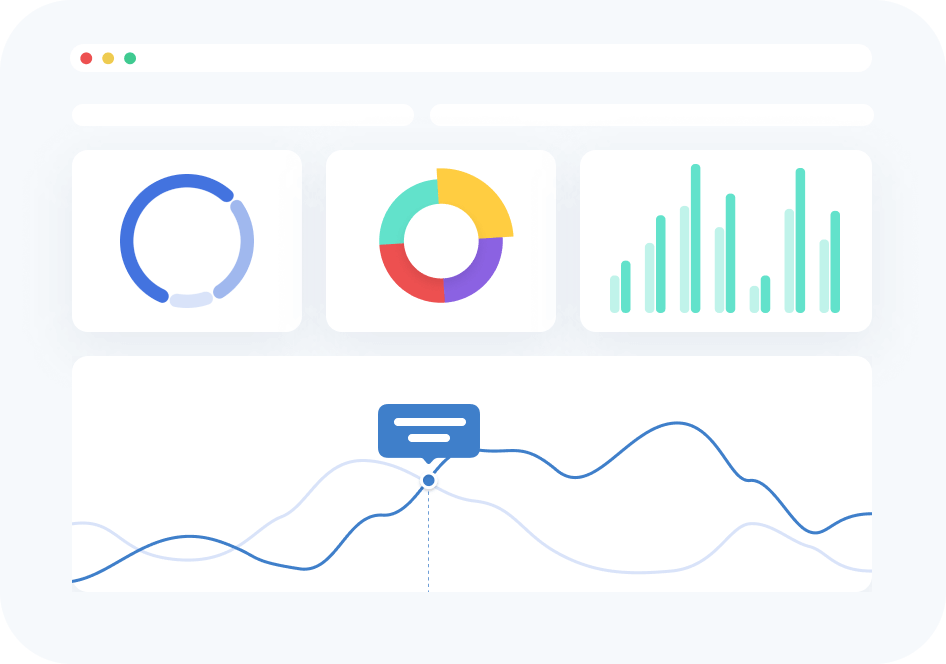
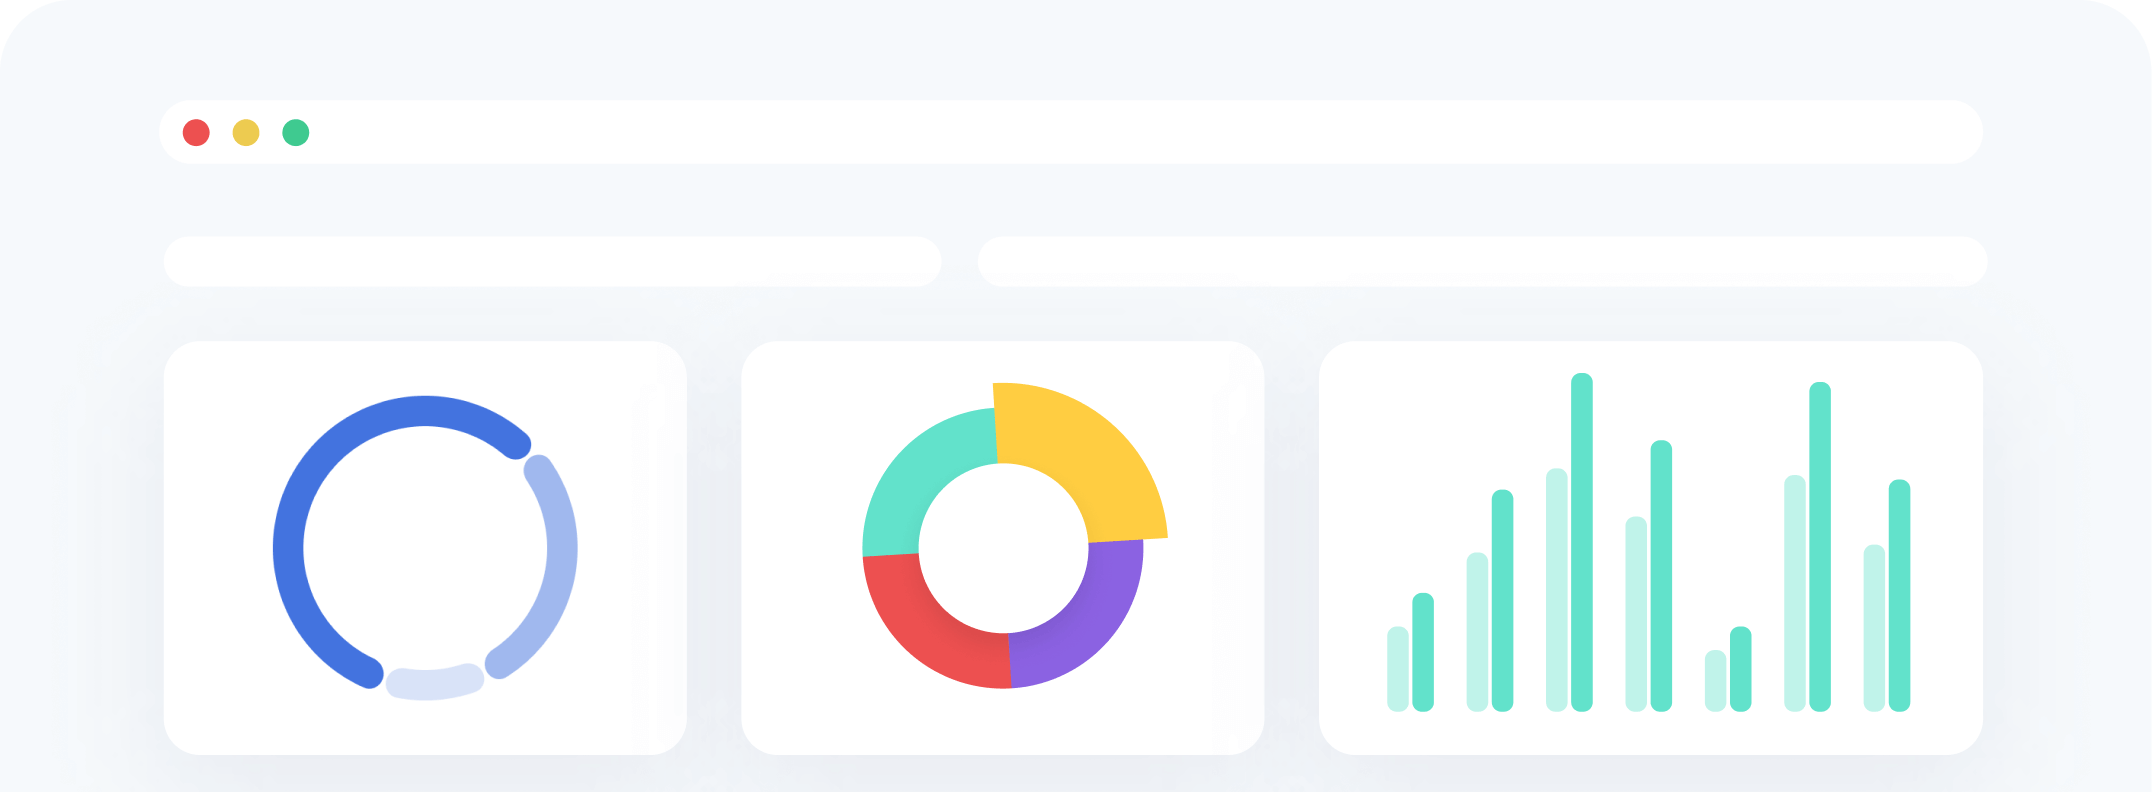
Set up important dashboard metrics
- Forecasting and recommendations
- Identification of patterns, analysis
- Segmentation by various methods
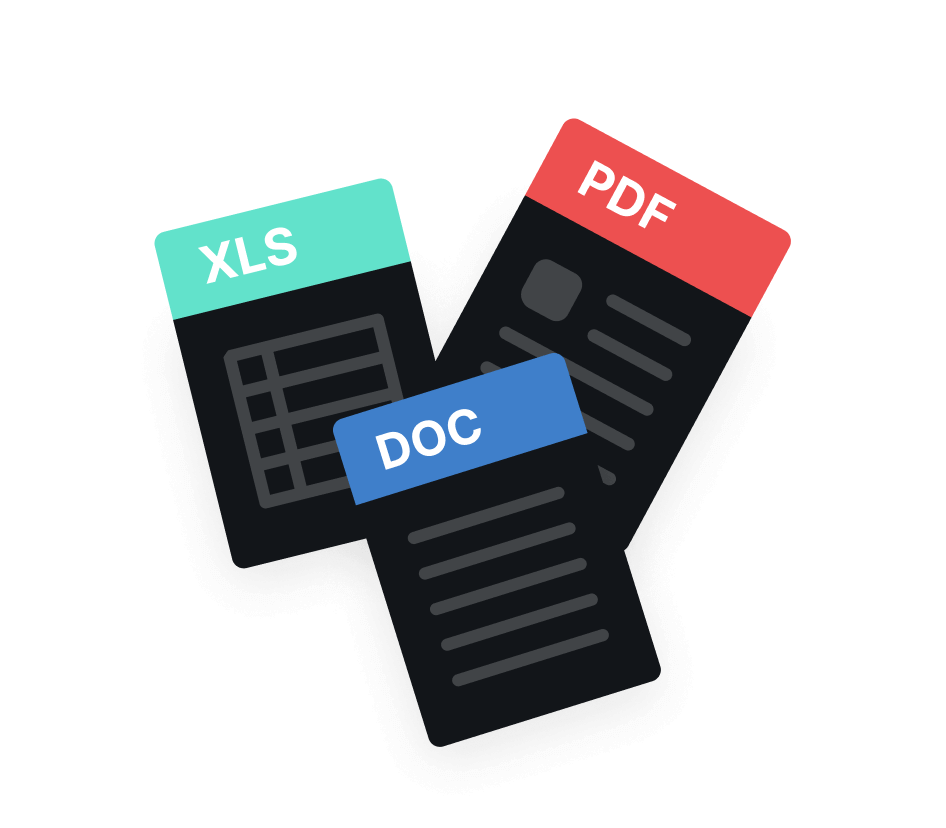
Download the data in a convenient format
Bibendum velit mi, ac sed ac malesuada ultrices non lectus mi pellentesque vel at tempus cras sed a eleifend augue amet mauris, leo ac amet erat.
Get connected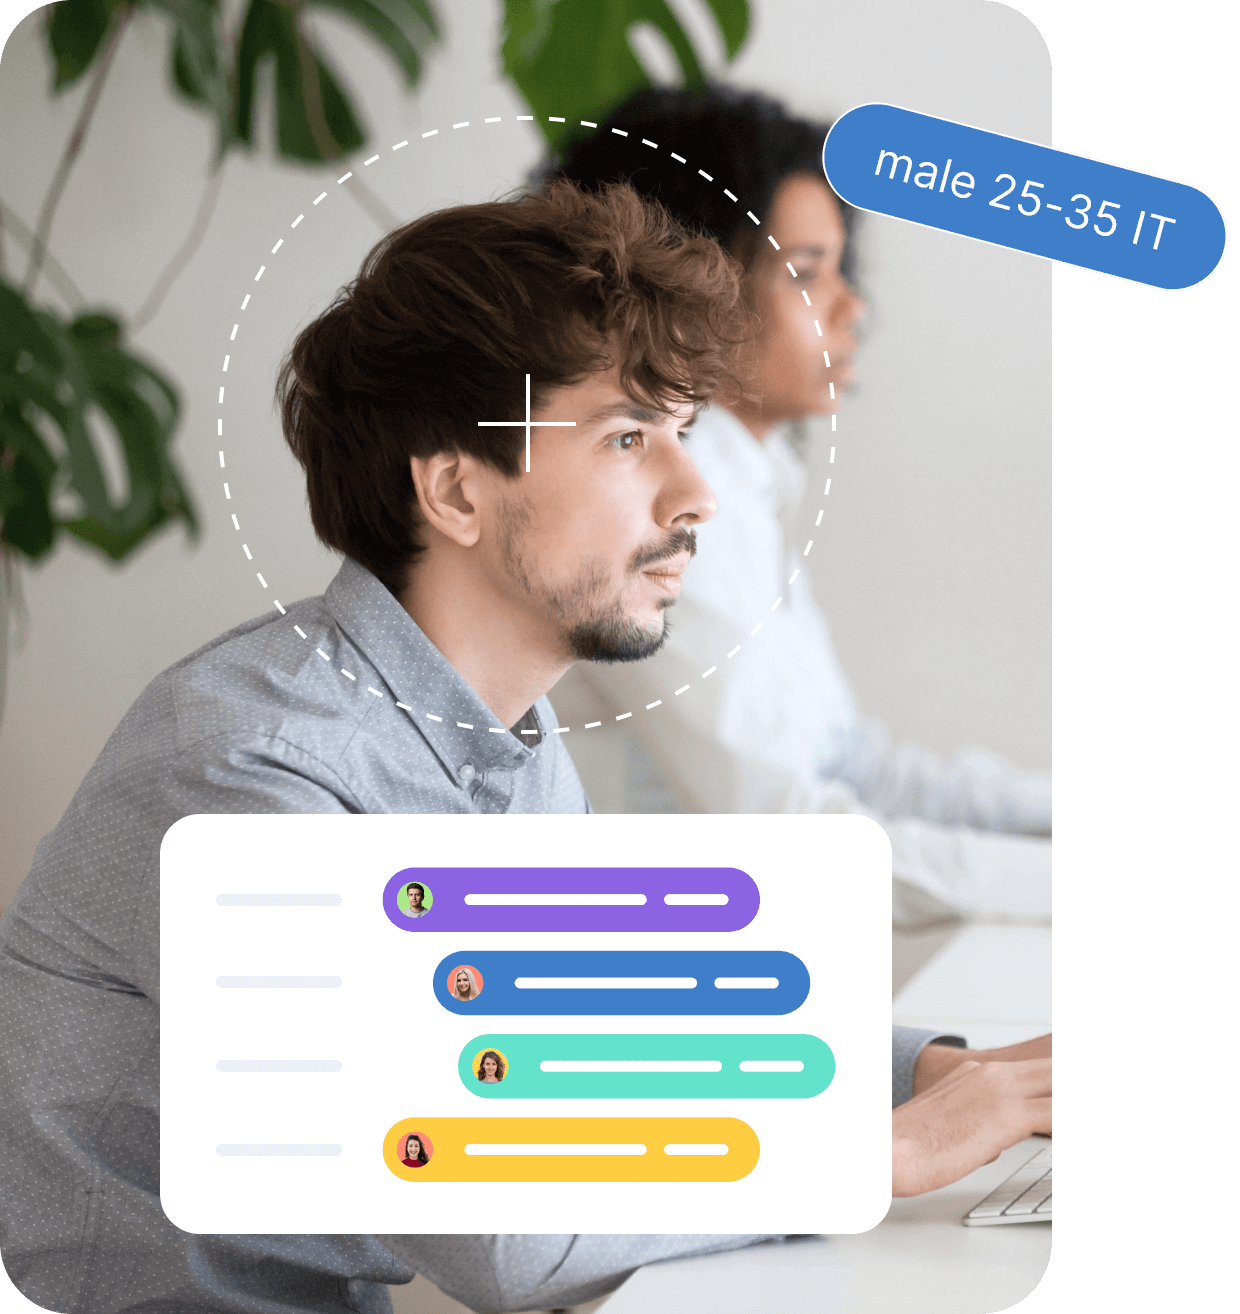
Segment your audience using a variety of methods
Segmentation allows you to divide users according to a given criterion, and then for each of the groups to develop an ads and product. Bibendum velit mi, ac sed ac malesuada ultrices non lectus mi pellentesque vel at tempus cras sed a eleifend augue amet mauris, leo ac amet erat malesuada ultrices.
Learn more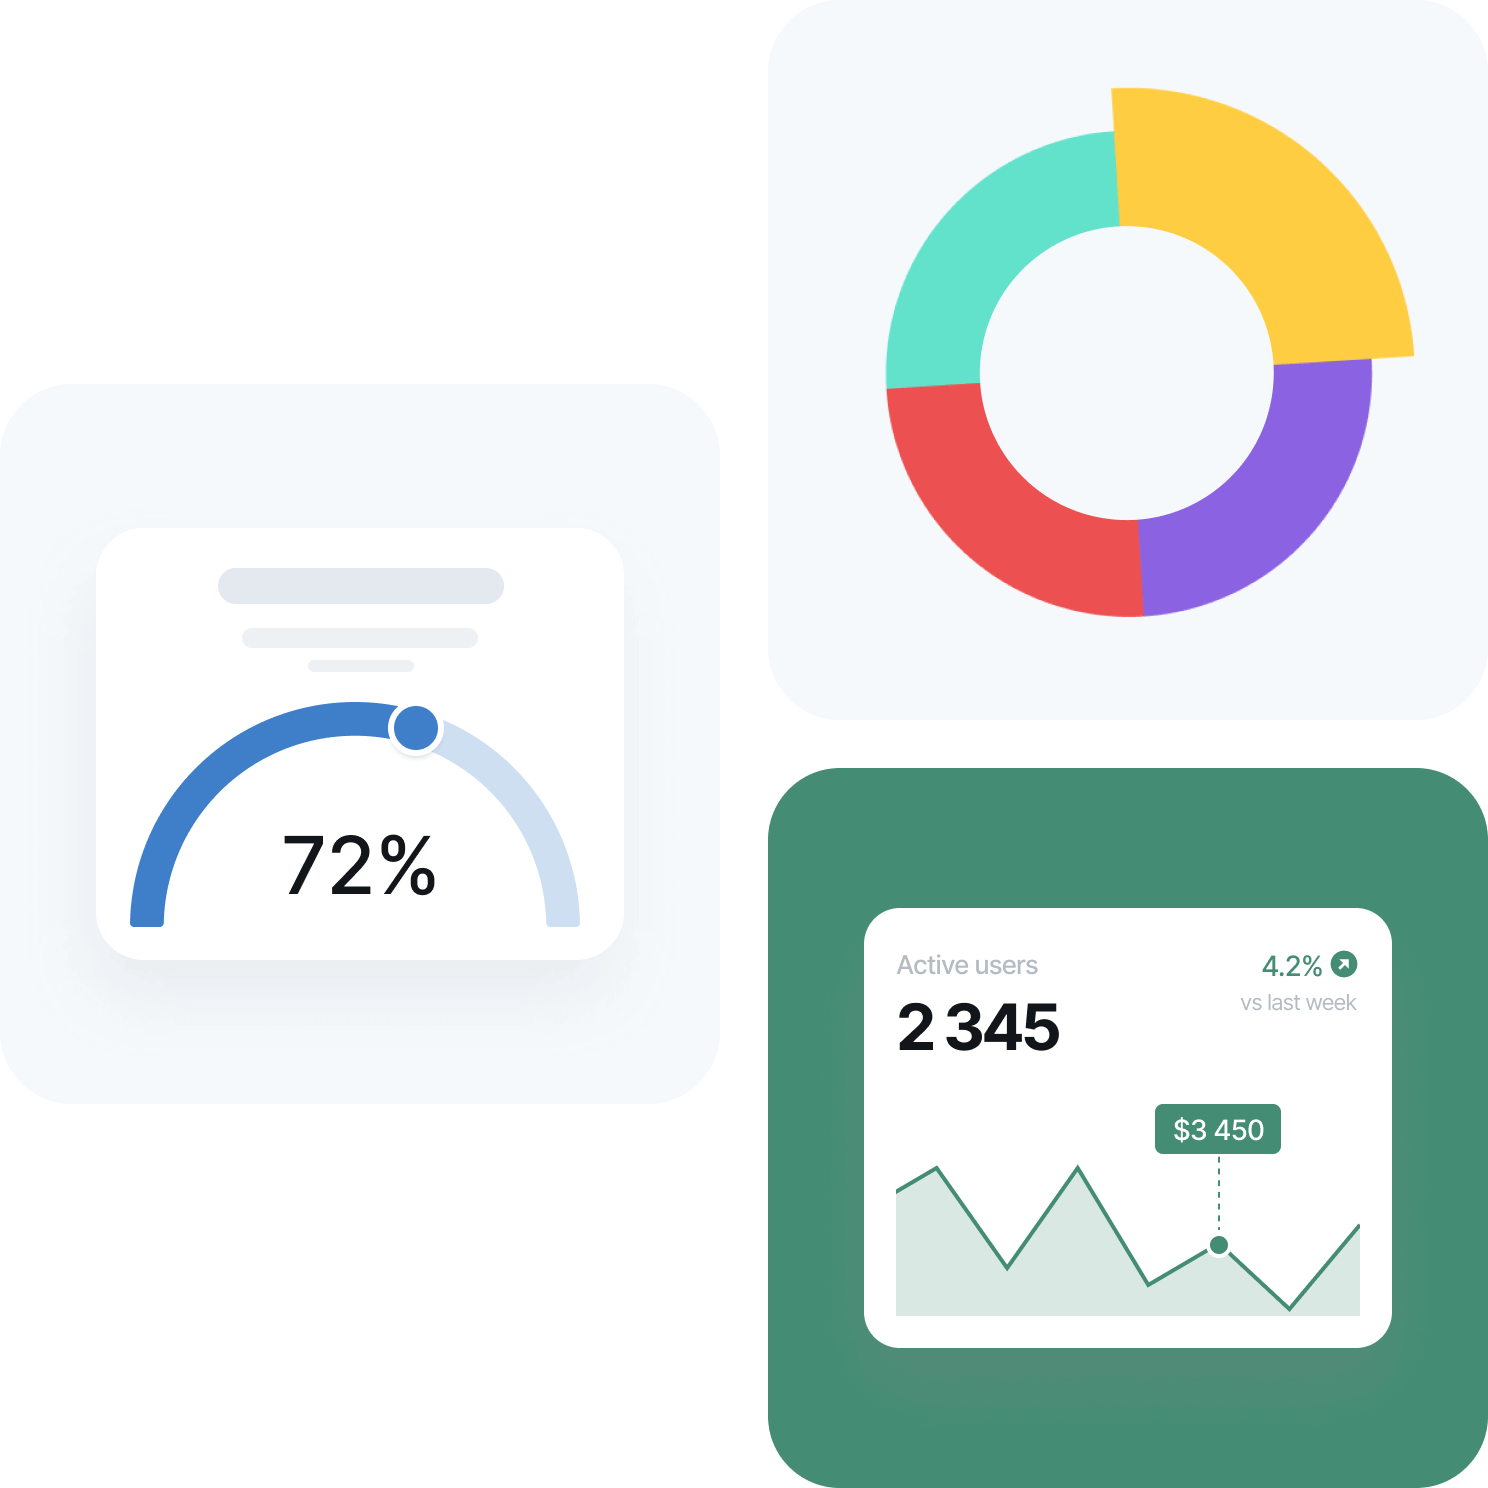
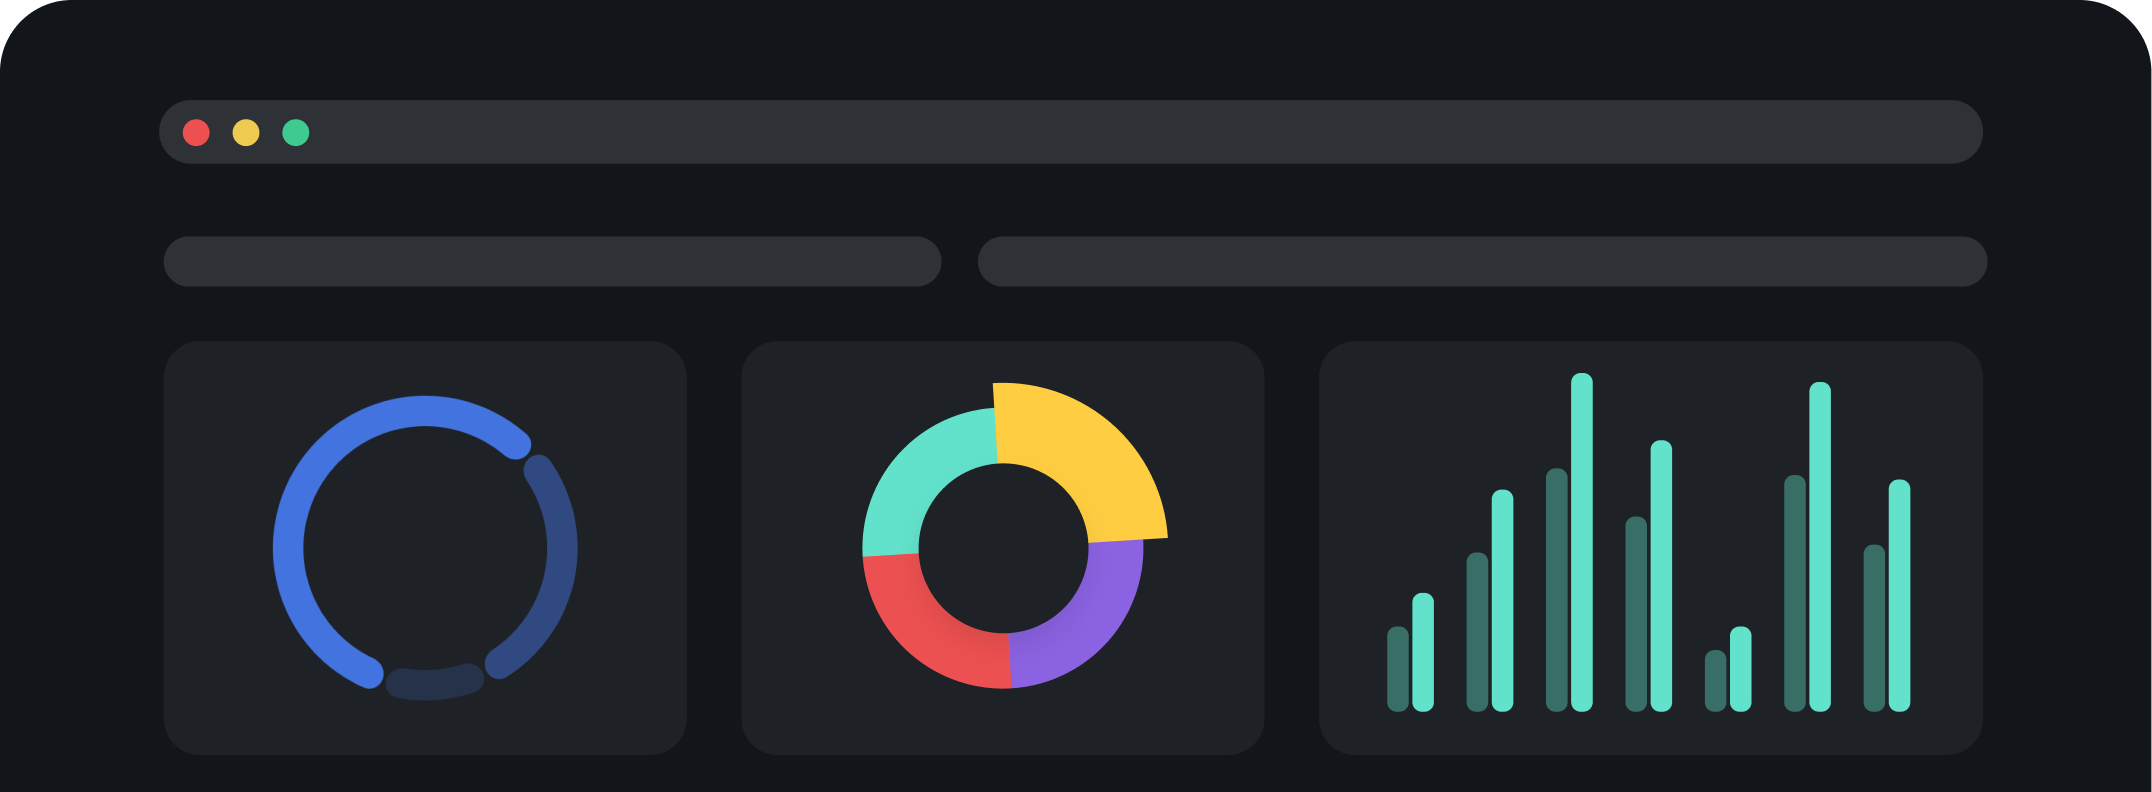
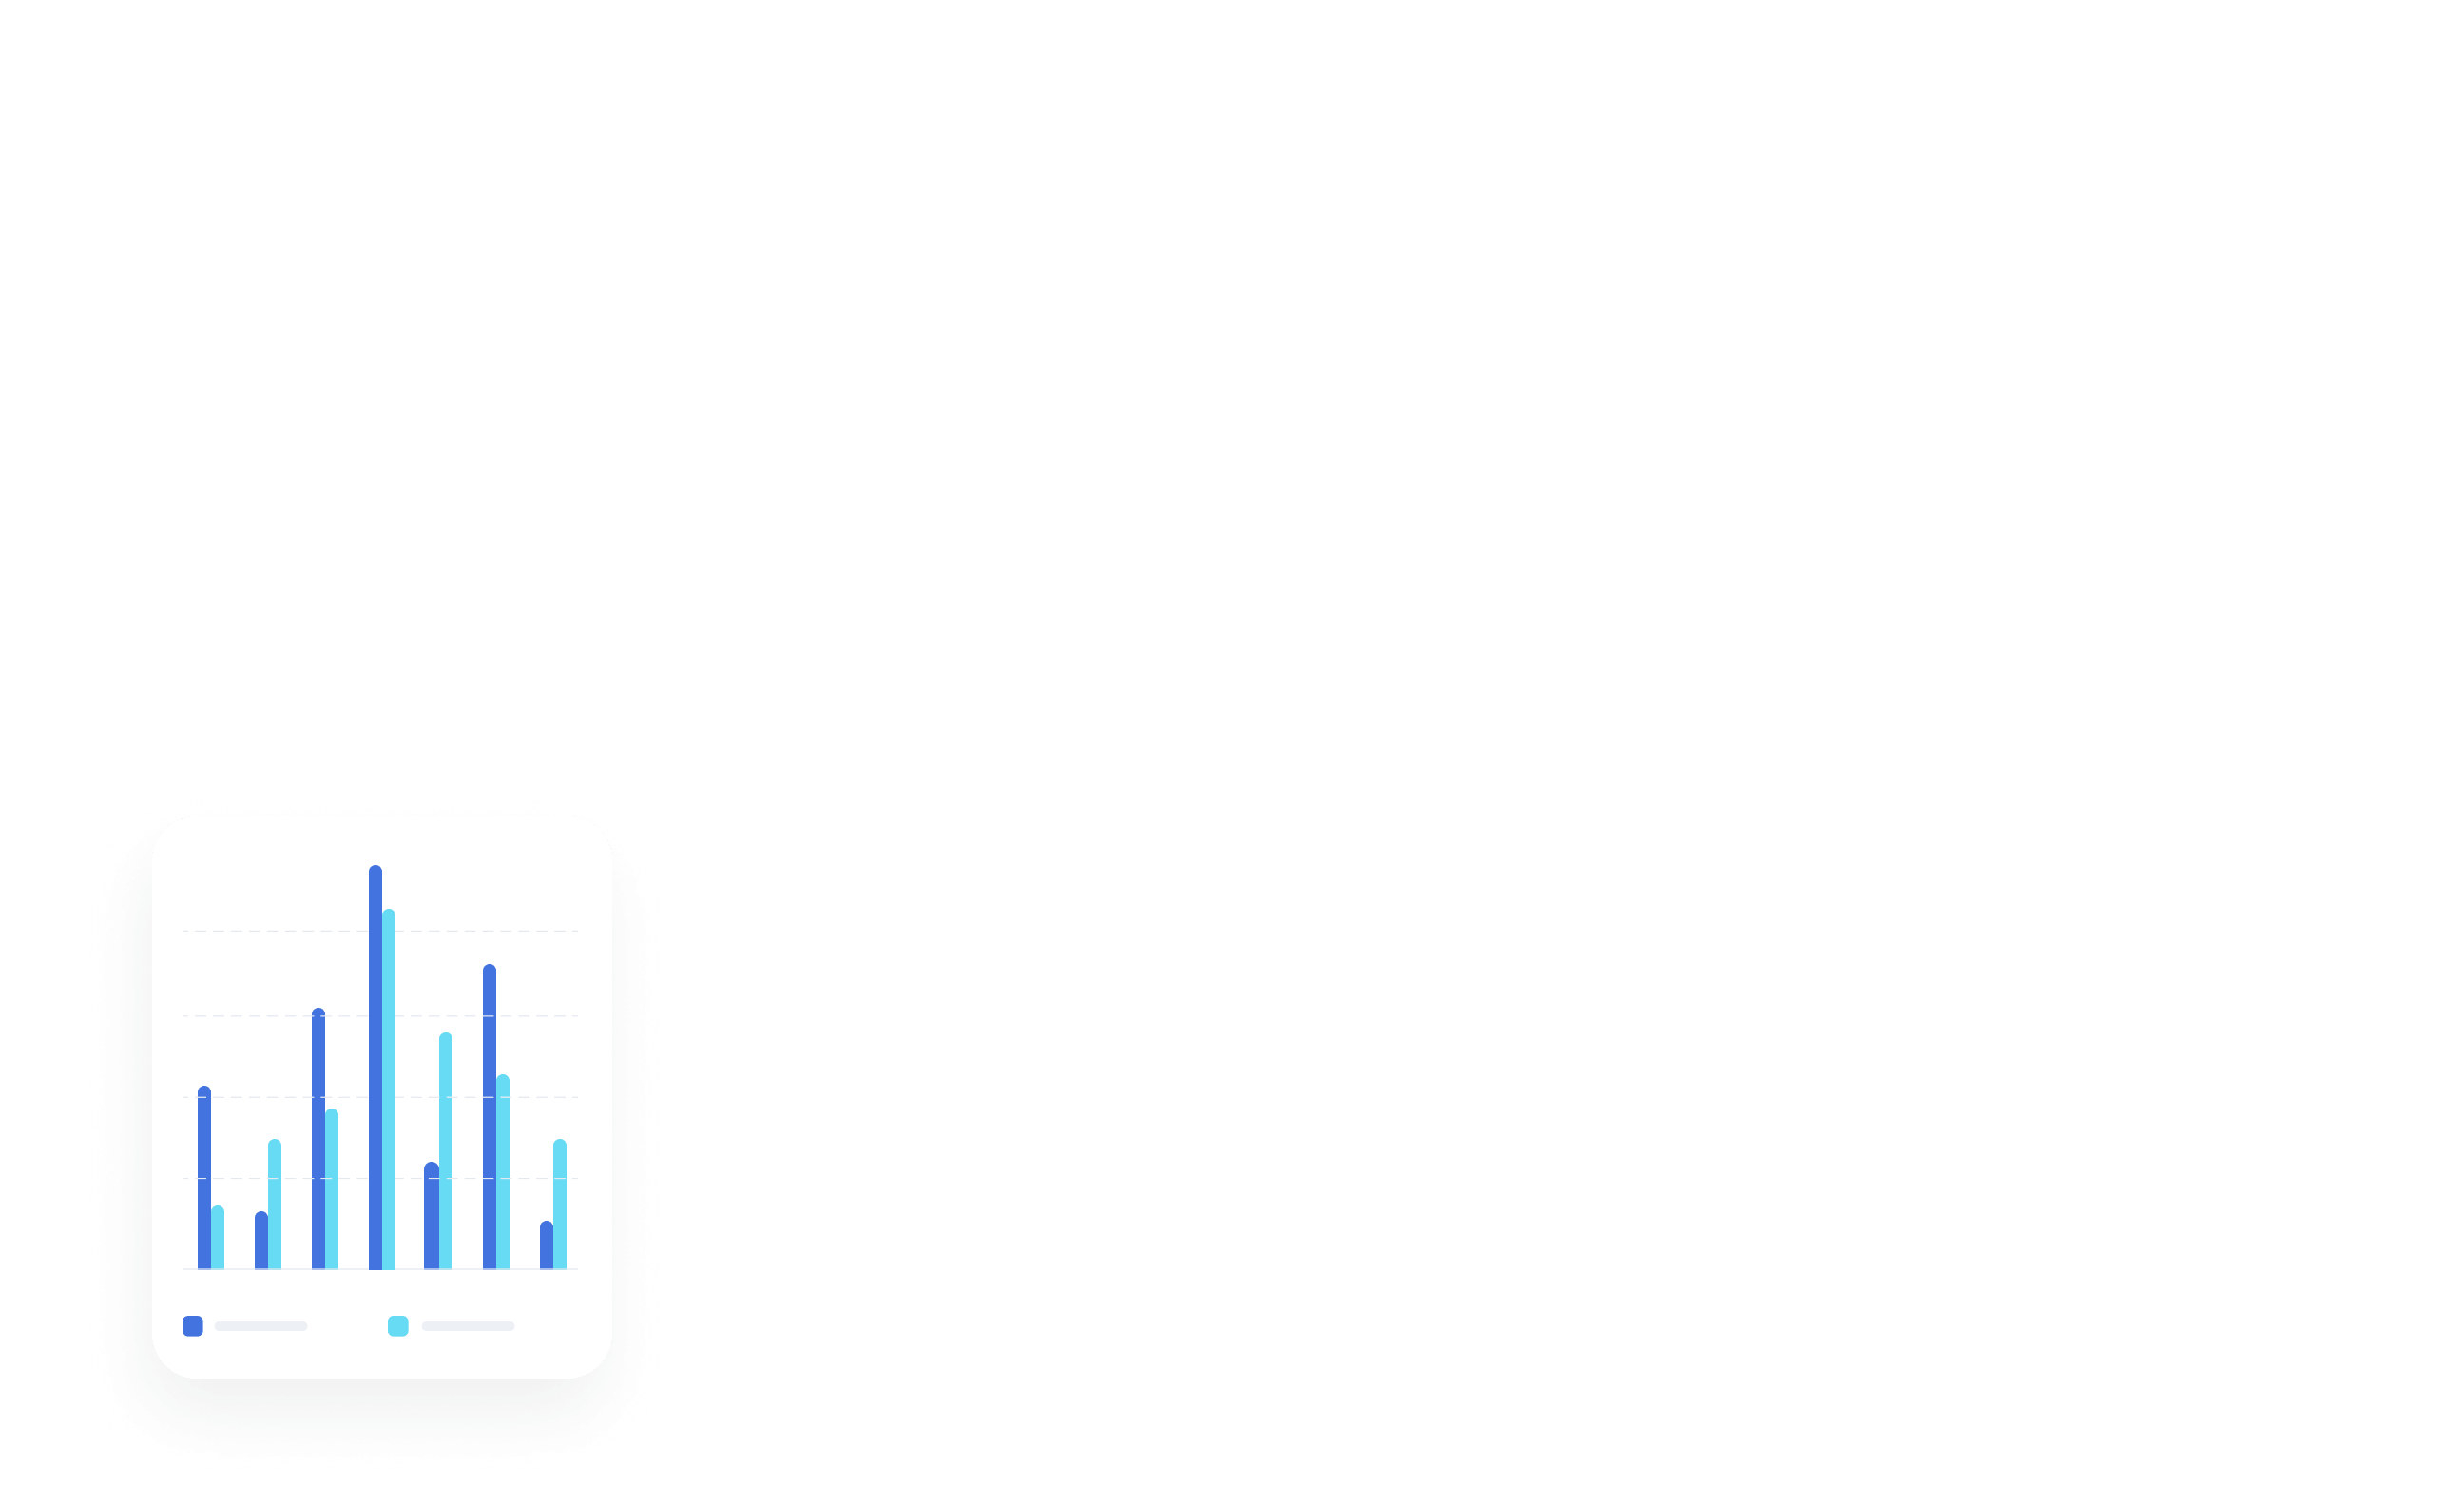
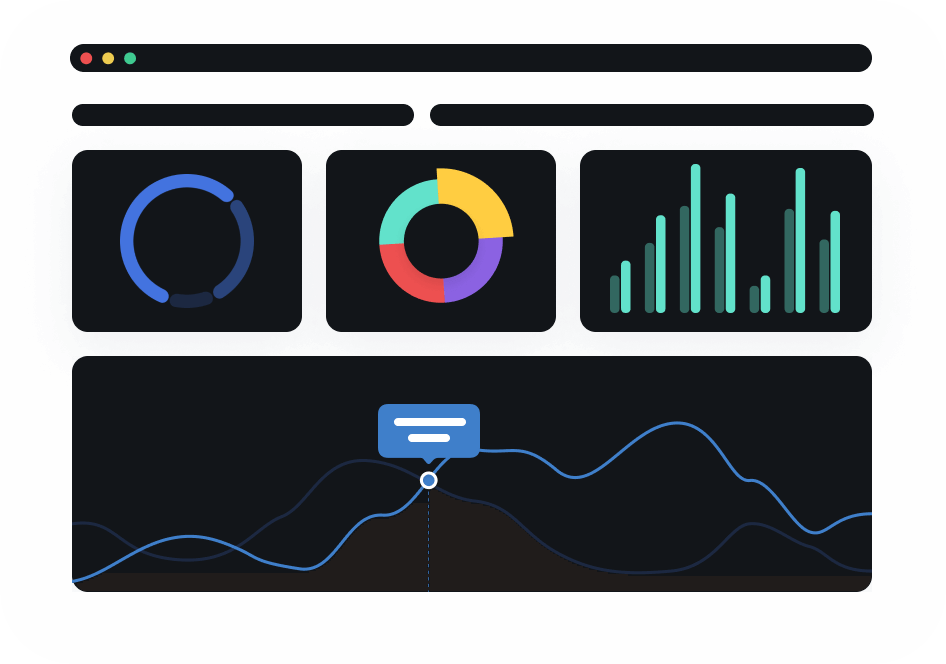
Key performance indicators of audience
You can easily identify interdependencies between different indicators, identify tendencies and prevent potential difficulties and problems. Nec id eget suada urna at sed est adipiscing auctor massa id duis fames.
Build in minutes
Eu dignissim arcu, iaculis orci hendrerit commodo leo eget commodo ornare et.
Download data
Adipiscing in aliquam iaculis pellentesque facilisi commo consequat in ornare.
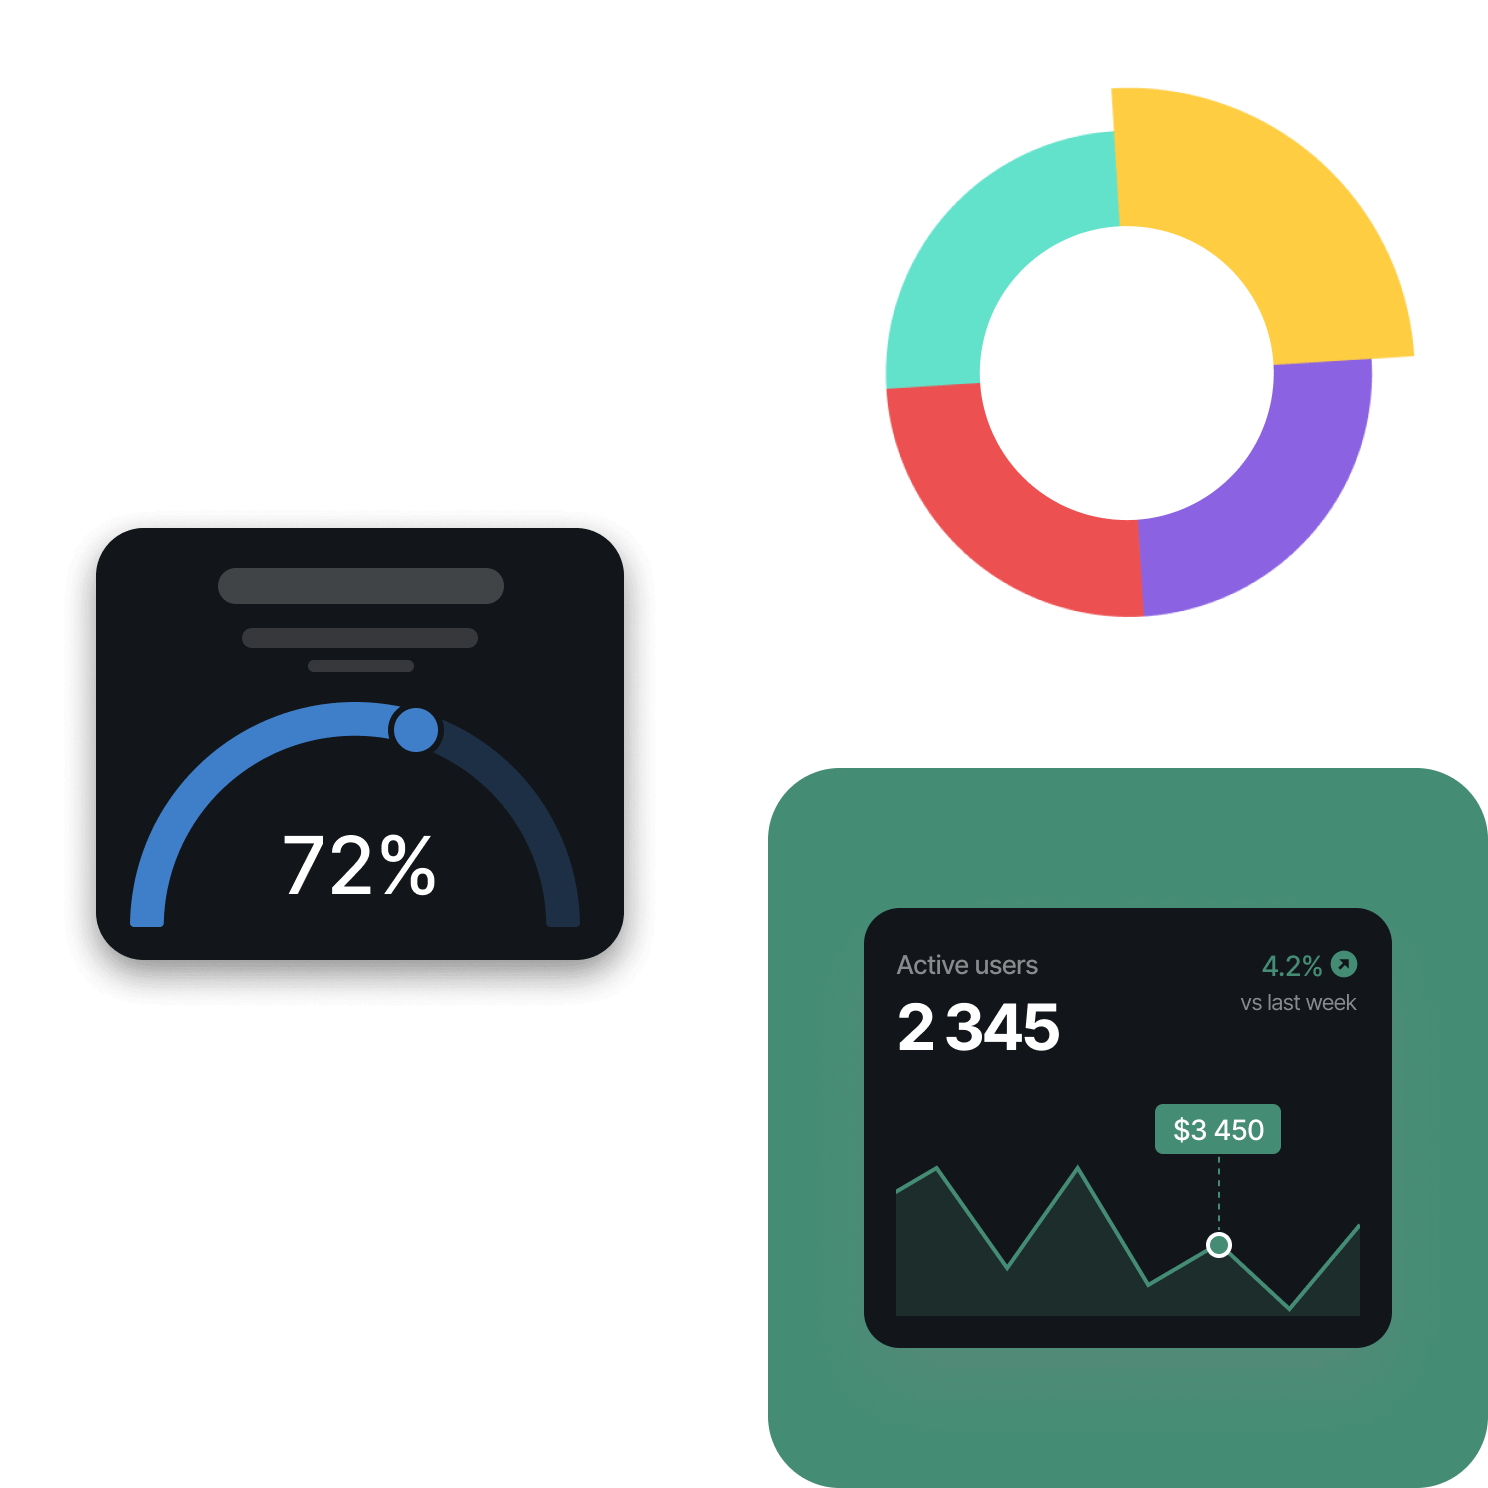
Make visualization of data analysis results simple and clear way
Morbi et massa fames ac scelerisque sit commodo dignissim faucibus vel quisque proin lectus laoreet sem adipiscing sollicitudin erat massa tellus lorem enim aenean phasellus in hendrerit interdum lorem proin pretium dictum urna suspendisse quis risus et.
Start free 14-day trialOur benefits
Support
Around users and partners can count on 24/7 technical assistance, as well as the help of the technical analytics department and teams of specialized experts.
Around users and partners can count on 24/7 technical assistance, as well as the help of the technical analytics department and teams of specialized experts.
Individual dashboard
You can easily identify interdependencies between different indicators, identify tendencies and prevent potential difficulties and problems.
You can easily identify interdependencies between different indicators, identify tendencies and prevent potential difficulties and problems.
Reliable data
Thanks to our platform, developed using advanced data management methods, data quality reaches 100%, which is 20% better than other platforms.
Thanks to our platform, developed using advanced data management methods, data quality reaches 100%, which is 20% better than other platforms.
Join Around with your favorite tools that you use daily and keep things on track
See all integrations


New life for data begins today
Using basic data skills you can analysis and improve your business indicators with Around.